Reading the Map: A Data-Driven Framework for Identifying Neighborhoods Poised for Growth
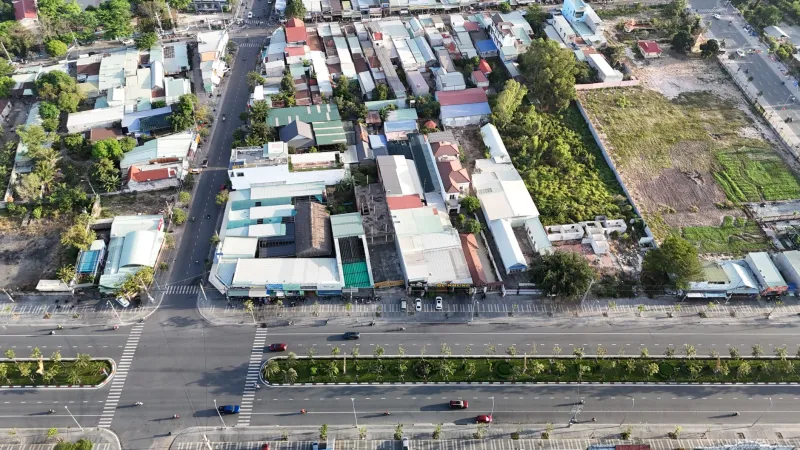
Every experienced real estate investor understands a fundamental truth: the right property in the wrong neighborhood is a liability, while a modest property in an emerging neighborhood can become one of the most rewarding financial decisions of a lifetime. The difference between those two outcomes rarely comes down to luck. It comes down to data.
At Century 21 Atlas, we believe that informed buyers and investors are empowered ones. Whether you are purchasing your first home with an eye toward long-term equity or actively seeking undervalued markets for investment purposes, learning to read neighborhood data the way a professional does is one of the most valuable skills you can develop. Consider this your starting point.
Why Neighborhood Analysis Matters More Than the Property Itself
It is tempting to fall in love with a home's finishes, square footage, or curb appeal. But real estate professionals consistently emphasize that location — specifically, the trajectory of that location — determines long-term value far more than any structural feature. A kitchen can be renovated. A neighborhood's economic direction is far harder to reverse.
The neighborhoods that produced the most dramatic appreciation over the past two decades — areas like the Short North in Columbus, Ohio, or East Nashville, Tennessee — shared common measurable characteristics years before their transformation became obvious. Investors and buyers who recognized those signals early captured enormous gains. Those who waited until the neighborhood was already celebrated paid a premium for the privilege.
The goal of neighborhood analysis is to identify those signals before the broader market does.
Demographic Trends: Following Population Movement
One of the most reliable early indicators of neighborhood appreciation is a shift in demographic composition. Specifically, analysts look for an influx of younger residents — particularly millennials and Gen Z households — into previously overlooked areas. This cohort tends to prioritize walkability, access to transit, and proximity to employment centers, and their arrival in a neighborhood frequently precedes commercial investment and rising property values.
The U.S. Census Bureau's American Community Survey (ACS) provides detailed, publicly accessible data on age distribution, household composition, and population growth at the census tract level. Comparing five-year estimates across multiple reporting periods can reveal whether a neighborhood is gaining or losing residents in key demographic categories — information that often signals broader economic momentum or decline.
Beyond age, pay close attention to changes in educational attainment levels within a ZIP code. A rising percentage of college-educated residents frequently correlates with increasing household incomes and, subsequently, higher demand for quality housing.
Income Levels and Employment Proximity: The Economic Foundation
Median household income trends are among the most direct predictors of housing demand. When incomes in a given area are rising faster than the city or regional average, it typically signals that higher-earning households are choosing to live there — a dynamic that puts upward pressure on property values.
Equally important is the relationship between a neighborhood and major employment centers. The expansion of a hospital system, the announcement of a corporate headquarters relocation, or the development of a technology campus within commuting distance can fundamentally alter a neighborhood's desirability almost overnight. Amazon's HQ2 announcement in 2018 triggered measurable price appreciation in the surrounding Arlington, Virginia, market well before a single employee arrived on campus.
Publicly available tools such as the Bureau of Labor Statistics' local area unemployment data, combined with municipal economic development announcements, can help investors identify these employment-driven catalysts early.
School Ratings: A Proxy for Community Investment
For many buyers — particularly those with families or those who anticipate selling to families — school district quality is a primary consideration. But even investors without children should monitor school performance ratings carefully, as they function as a reliable proxy for community investment and neighborhood stability.
Resources such as GreatSchools.org aggregate ratings based on academic performance, student progress, and equity metrics. A neighborhood where school ratings are trending upward over a three-to-five-year period often reflects broader improvements in local governance, public funding, and community engagement. Conversely, declining ratings can signal fiscal stress or demographic challenges that may weigh on property values.
It is worth noting that school district boundaries do not always align with neighborhood boundaries, so cross-referencing school catchment maps with property locations is an essential step in any thorough analysis.
Crime Statistics: Context and Trajectory Matter
Crime data is frequently misused in real estate analysis. A neighborhood with historically elevated crime rates that has demonstrated consistent, year-over-year improvement may represent a far stronger investment opportunity than a low-crime area that has plateaued in terms of growth. What matters most is the direction of the trend, not the absolute number.
The FBI's Uniform Crime Reporting (UCR) database and local police department crime mapping tools — many of which are now publicly accessible online — allow analysts to track both violent and property crime rates over time. When crime statistics are declining in tandem with rising income levels, improving school ratings, and new commercial development, the convergence of those signals is particularly compelling.
Development Plans and Infrastructure Investment: Reading the Blueprint
Perhaps the most underutilized source of neighborhood intelligence is publicly available municipal planning data. City council meeting minutes, zoning variance applications, approved development permits, and comprehensive plan documents are typically accessible through local government websites — and they contain a wealth of forward-looking information that most buyers never consult.
The announcement of a new light rail station, the approval of a mixed-use development project, or a significant streetscape improvement initiative are all indicators that local government and private capital are betting on a neighborhood's future. These investments tend to be self-fulfilling: infrastructure attracts residents, residents attract businesses, and businesses attract further investment.
Real estate professionals routinely monitor these planning channels as part of their market intelligence process. Buyers and investors who do the same gain a meaningful informational advantage.
Synthesizing the Data: Building Your Neighborhood Scorecard
No single data point tells a complete story. The most effective approach is to build what analysts sometimes call a neighborhood scorecard — a structured framework that aggregates multiple indicators into a composite assessment.
Consider assigning weighted scores to the following categories: population growth trend, median income trajectory, school rating movement, crime rate direction, proximity to employment growth, and confirmed development activity. A neighborhood that scores positively across most or all of these dimensions, yet still carries below-average property prices relative to the broader metro area, represents the profile that professional investors actively seek.
This is not a guarantee of appreciation — real estate markets are subject to macroeconomic forces that no local analysis can fully anticipate. But it is a disciplined, repeatable methodology that meaningfully improves the probability of sound decision-making.
Putting the Framework to Work
The data tools required to conduct this kind of analysis are largely free and publicly accessible. The Census Bureau, the Bureau of Labor Statistics, local planning departments, and school rating platforms collectively provide most of what an informed buyer or investor needs. What they require is time, organization, and a willingness to look beyond the surface of a listing.
At Century 21 Atlas, our agents are trained to incorporate this kind of market intelligence into every client conversation. If you are evaluating a property and want a professional perspective on the neighborhood's data profile, we encourage you to reach out. The map to the perfect property begins with understanding exactly where that property sits — not just geographically, but economically.